|
|
 |
| aaa a |
Differences between web
sessions according to the origin of their
visits
Jose Luis Ortega
R&D Analysis, Vice-presidency for
Science and Technology, CSIC, Serrano, 113, 28006,
Madrid, Spain,
jortega(a)orgc.csic.es
Isidro
Aguillo
Cybermetrics Lab, CCHS-CSIC, Albasanz,
26-28, 28037, Madrid, Spain
isidro.aguillo(a)cchs.csic.es
Cite
as: Ortega, J. L., Aguillo, I. F. (2010), Differences
between web sessions according to the origin of their
visits. Journal
of Informetrics, 4(3): 331-337
Abstract
The aim of this
paper is to characterize the distribution of number of
hits and spent time by web session. It also expects to
find if there are significant differences between the
length and the duration of a session with regard to the
point of access -search engine, link or root. Web usage
mining was used to analyse 17,174 web sessions that were
identified from the webometrics.info web site. Results
show that both distribution of length and duration
follow an exponential decay. Significant differences
between the different origins of the visits were also
found, being the search engines’ users those who spent
most time and did more clicks in their sessions. We
conclude that a good SEO policy would be justified,
because search engines are the principal intermediaries
to this web site.
Introduction
One of the most important fields of
the Informetrics, and one of the less studied, is the
analysis of the information usage of web sites. Through
the analysis of web log data we can analyse the
behaviour of a web surfer in a web site, extracting
navigational patterns about their favourites pages,
describing the used paths in order to access to relevant
information and checking the reliability of our web
design and architecture. Although business and
commercial web sites have paid soon attention to the
gathering and processing of information about the
behaviour of their customers (Gomory et al., 1999), as
an extension of the data mining techniques applied in
their client databases, this academic field has
attracted little interest mainly due to the difficulty
of obtaining this type of data and comparing similar
patterns of different web log sources.
Even then, web log
analyses have been carried out in order to improve the
web design (Spiliopoulou, 2000), as a way to evaluate
the quality of library catalogues (Peters, 1993; Kurth,
1993) or to understand information flows (Thelwall,
2001). The first studies were focused in the
functionality of the search engines, describing query
patterns in Altavista (Silverstein et al., 1998; 1999;
Anick, 2003), Excite and Alltheweb (Jansen and Spink,
2006) and Yahoo! (Teevan et al., 2006). However, several
studies were focused more in the definition of web
sessions than in the number of hits. Data mining was
used to the identification of web sessions (Cooley et
al., 1997; 1999), to estimate their duration and their
length in clicks (Pitkow, 1997; He et al., 2002) and to
classify content according to the pages requested by
their visitors (Wang and Zaïane, 2002). Several
techniques have been used to improve and help the
session extraction and processing such as the
statistical language model (Huang et al., 2004), fuzzy
logic (Nasraoui et al., 1999) and Markov models
(Deshpande and Karypis, 2004). Other papers have
addressed the visualization of web sessions as a way to
uncover navigational patterns (Hochheiser and
Shneiderman, 1999; Lam et al., 2007).
Few papers
have characterized the distribution of sessions
according to the number of hits or the time spent in the
web site. Markov and Larose (2007) compared the web logs
of the Central Connecticut University State and the
Environmental Protection Agency (EPA) web sites, finding
an exponential decay in the distributions of session’s
duration and length. Other works also found skewed
distributions in the length and duration of the web
search sessions (Cooley, 1999; Jansen et al., 2005).
Nevertheless, there are no works that have shown how the
point of access (entry page) or referrer page affects to
the further navigation in the website.
Objectives
The aim of this paper
is to solve the following
questions:
-
Is it possible to
know how many sessions have a length of certain
clicks?
-
Is it possible to
characterize and estimate the number of sessions that
last certain time?
-
Is it the length
of a session different according to the point of
access of each user?
-
Is it the time
that a user spent in a website different according to
the point of access used?
Methods
Data processing
The Web ranking of
World universities (webometrics.info)
is a website that ranks 6,000 universities according to
two main criteria: size (number of pages and rich files)
and visibility (number of incoming links). It is the
most complete and updated ranking of universities web
domains. This website is very popular with more than 3
million visitors per year and a Page Rank of 8. We think
that the high visibility of this site provides a good
sample to study the access pattern of a
website.
Web log transactions
from 2006 July were selected as a sample to carry out
our session analysis. The web log file was cleaned
according to several criteria, removing the following
accesses:
-
To graphic files
(gif, jpg and png)
-
To style sheets
(css)
-
Which do not
request a petition (get)
-
From the own
website editor IPs (161.111.200.*)
-
Made by crawlers
or bots (Googlebot, Msnbot, Slurp, Gigabot, etc.)
After this process,
526,004 unique accesses were identified. To rebuild the
performed sessions, we used the web usage mining
technique (Cooley et al., 1997, 1999). This technique is
developed in three stages:
-
User identification: Although
webometrics.info does not allow to identify users
through cookies or registration, we identified each user
through a unique IP.
-
Session identification: We
established a time limit of 30 min. (Catledge &
Pitkow, 1995). Although a session may be more than 30
min., this standard measure allows us to separate
sessions with the same IP.
-
Session
rebuilding: Some accesses are not registered in the
log file because there are cache and proxies copies in
order to do not saturate the web server. These
accesses have been rebuilt through the web site
architecture.
After apply web usage mining techniques, we have
identified 14,174 sessions
aaa
| IP |
Date |
Time |
Access |
Referrer |
| 202.174.136.* |
26/06/2006 |
9:33:49 |
/top3000.asp.htm |
http://www.google.com.hk/search?q=webometrics... |
| 202.174.136.* |
26/06/2006 |
9:50:46 |
/top3000.asp-offset=50.htm |
http://www.webometrics.info/top3000.asp.htm |
| 202.174.136.* |
26/06/2006 |
9:53:54 |
/university_by_country_select.asp.htm |
http://www.webometrics.info/top3000.asp-offset=50.htm |
| 202.174.136.* |
26/06/2006 |
9:55:16 |
/methodology.html |
http://www.webometrics.info/top3000.asp-offset=50.htm |
Table
1. An example of web session with length 4 and from a
search engine
We defined
three main ways to access to a website: 1) through a
search engine request: a query launched to a search
engine allows to retrieve a link to the website
demanded; 2) through a web link: surfing the web we may
access to a website through a link from other website;
3) through the website root: typing in our web browser
the URL of the website demanded. So, we classified the
sessions in accesses through a search engine, through a
web link and typing the URL (root). The origin of each
session was detected through the referrer field in the
log file. So, we observed the referrer of the access
that originated the session. For example, this session
(Table 1) was created from a search engine query, and
then it was classified in the search engine category.
We also
classified each session according to its length. We
define the length as the number of access carried out by
the same IP in an interval less than 30 min. This
timeout has been defined as a standard measure in
several studies (Mahoui and Cunningham, 2000; Mat-Hassan
and Levene, 2005; Jansen et al. 2007) from the empirical
observations of Catledge and Pitkow (1995). This
convention is used because it is impossible to observe
when a user leaves a web page form the web log data.
This lack of data affects to the exact definition of the
session length because we can not know how many time one
user spends in the last page (Huntington, Nicholas &
Jamali, 2008). Due to this, the last view was not
computed. We understand that this technical limitation
is the same for the three types of access, so the
differences in the session length will be the same in
root, link and search engine access. The above session
(Table 1) was defined as 4 length session, because the
fifth access was made after than 30 min. and it includes
four accesses in less than 30 min. between them. As we
said before, this is the limit to separate different
sessions.
Statistic
tools
To process
the data and to answer the above questions we used
several statistical tests:
-
Kruskall-Wallis H test (1952) detects if n data groups
belong or not to the same population. This statistic is
a non-parametric test, suitable to no-normal
distributions such as the exponential distributions
observed in web log analysis.
-
Dunn’s post test (1961) compares
the difference in the sum of ranks between two columns
with the expected average difference (based on the
number of groups and their size). It is used after to
apply the Kruskall-Wallis or Friedman test. The Dunn’s
test shows what samples are different.
Results
Session length
We
defined a k-session as the number of k access performed
by a unique user in a time interval of >30 seconds,
between one access and other.
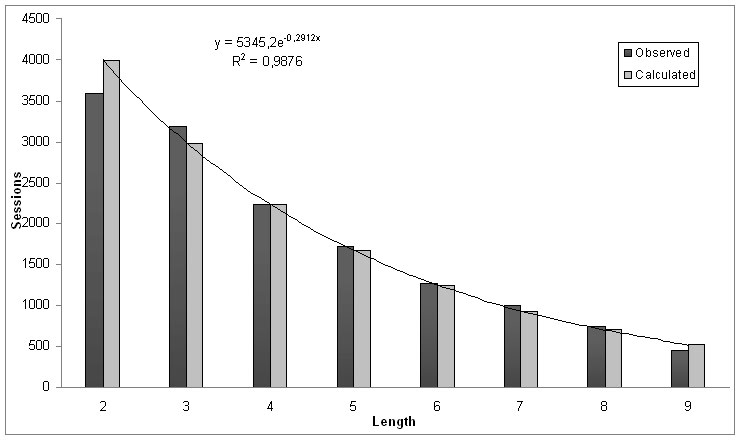
Figure
1. Distribution of observed and calculated sessions by
length
Figure 1 shows the observed and
calculated number of sessions according to the length of
each session. Thus, we observed 3586 (25,3%) 2-sessions,
3188 (22,5%) 3-sessions, 2227 (15,7%) 4-sessions and so
on. We also appreciated that the length distribution of
sessions follows an exponential decay (Bianco et al,
2005) similar to the observed in other longitudinal web
phenomena (Ortega et al, 2009). The fit of the
distribution is high (R2=.98), so we may estimate the
number of sessions by length not identified. We may
hence estimate that there are 388 10-sessions and 290
11-sessions.
We
introduce a new indicator, half-length, which allows us
to detect the median value in non-parametric
distributions. It shows what n-sessions are the most
frequent ones and the maximum number of clicks is needed
to request the information demanded in the website.
Mathematically the half length is expressed
as:

where the
half-length l1/2 is the natural logarithm of 2
divided by the decay constant (lamda) and is found from the
exponential regression:

where
Wa is the number of Web pages which have the
length a
and W1 is
the number of 1-sessions.
In our sample the
half-length or median is 2.38, so we can argue that more
than the half of the sessions has a length 2, if one
surfs through the
webometrics.info
website. This low length is because this website is a
ranking of universities and its information is displayed
through tables which are accessible with just two
clicks. We think that this indicator makes possible to
characterize the length of the sessions and detect if
the browsing of a website is fast or slow, their
contents can be quickly located or otherwise it has a
winding architecture with makes contents hardly
accessible.

Figure 2. Marginal distribution of
sessions by length
We
intend to see if the length of a session is related to
the referrer of each session or the length is
independent of the place from the user comes. As we see
before, the sessions have been classified in three
classes: sessions from a search engine, from a link in
other website and from the root URL typed in the web
browser. The Figure 2 and Table 2 show slight
differences between the three classes of sessions, being
the sessions from search engines referrer those with the
largest mean (4.163) and the sessions from the root the
ones with the smallest mean (4.069). The half-length or
median shows that the first half of the link sessions
has a length lesser than 2.42 clicks, while the root
half has a length lesser than 2.33 clicks. To detect if
these differences between the marginal distributions are
or not statistically significant, we have used the
Kruskall-Wallis test.
| K
(Observed value) |
6.314 |
| K
(Critical value) |
5.991 |
| DF |
2 |
| p-value (Two-tail) |
0.043 |
| Alpha) |
0.05 |
| Sample |
Frequency |
Mean |
Median
(half-length) |
Standard deviation
|
Groups |
| Root |
1620 |
4.069 |
2.33 |
2.018 |
A |
| Link |
3487 |
4.155 |
2.42 |
2.016 |
A/B |
| Search engine |
9066 |
4.163 |
2.38 |
1.977 |
B |
Table 2. Kruskal-Wallis test with
the Dunn’s post test
Table 2 shows that
there are significant differences between the three
access methods in the web navigation (p-value=.043;
a= .05). So we can assume that the referrer may
be an important factor in determining the number
of clicks that a user does in a navigation session.
The bilateral tests between the three types of session show
that those differences are significant between the
session from search engines and the session
from the root. However, there is no difference
between sessions from links and the other
two ones.
Session
length
The
duration of the web sessions was defined as the total
time performed by a unique user during the website
navigation in which a time interval of = 30 seconds was
carried out between one access and other.

Figure 3. Sessions frequency
distribution by duration (sec.), (log-log).
Figure 3 shows the
distribution of sessions by their duration in seconds.
It follows an exponential model with a high fit
(R2=
.94).The equation that better describe
the session duration
is:

Where Si is the number of sessions that last
i seconds, S1 the number of sessions that
last 1 second and lamda is the decay constant
(lamda=.99). This good fit
allows us to estimate how many sessions last i seconds.
For example, this model estimates 2074 sessions with
duration of 30 sec., 3609 ones with 60 sec., and 5584
ones with 120 sec. If we interprete it from a cumulative
point of view, 14.66% of the sessions have a duration of
less or equal than 30 sec., 25.51% ones are less or
equal than 60 sec., and 39.47% ones are less or equal
than 120 sec. In our sample, we found that the most
frequent session duration is 10 sec., while the 50% of
the sessions have a duration higher than 2.2
min.

Figure 4. Marginal distribution of
sessions by duration, grouped by type of
access
| Duration |
Frequency |
R2 |
S1 |
lamda |
| Search engine |
9066 |
.916 |
44.06 |
.995 |
| Links |
3487 |
.87 |
22.86 |
.993 |
| Root |
1620 |
.8 |
18.07 |
.984 | Table 3. Fit and coefficients of
the three types of distribution
Figure 3
shows the frequency distribution of the three classes of
sessions according to their access point (search engine,
links and root), which also follow an exponential decay.
We observe that the sessions from search engines are
those with the largest duration distribution, followed
by Links and Root. Table 4 shows the principal
parameters of the three distributions. The fit in the
three distributions is high, although it decreases due
to the sample size. It is interesting to notice that the
decay constant (lamda) remain roughly the same in the
three samples (˜.99). We may estimate that the 13.41% of
the sessions from a search engines have duration of less
or equal than 30 sec., while the percentage of sessions
less or equal than 30 sec. is 17.66% for session from
links and 26.33% for sessions from the root.
| K (Observed value) |
234.728 |
| K (Critical value) |
5.991 |
| DF |
2 |
| p-value (Two-tail) |
<0.0001 |
| Alpha) |
0.05 |
| Sample |
Frequency |
Mean |
Median
(half-length) |
Standard deviation
|
Groups |
| Root |
1620 |
273.156 |
92 |
481.909 |
A |
| Link |
3487 |
234.281 |
108 |
439.560 |
B |
| Search engine |
9066 |
328.570 |
148 |
530.502 |
C |
Table 4. Kruskal-Wallis test with
the Dunn’s post test
Table 4 shows the
Kruskal-Wallis test for differences in non-parametric
sample distributions. Dunn’s post test confirms the
significant bilateral differences between the three
samples. So we can state that the duration of the
sessions is different according to the referrer of each
session. Being the users from the search engines who
most time pass in the website (median=148 sec.),
followed by link’s users (median=
108 sec.) and root’s users (median=
92
sec.).
Discussion
When a web log analysis is
done, one of the principal limitations is the dificulty
to generalize the results and put it in context with
other similar results. Most of them may be affected by
the own architecture of the website, the contents that
it offers and the navigational habits of their visitors.
The architecture may determinate the lenght of a session
and the contents the time that a user spends in the
website. Thus if we compare our results with the Markov
and Larose’s (2007) ones, we observe that the median
length of the webometrics.info sessions (2.38) is higher
than the CCSU website (1), but lower than the EPA
website (3). These differences may depend of the number
of pages that each website hosts and how those pages are
organized. In our case, 2.38 clicks is a high value
because webometrics.info is a reference website that
needs just two clicks to access to the demanded
information. We think that it is possible that users
explore different regional rankings or check the
position of different universities in those rankings.
However, if we compare the median duration of the
webometrics.info sessions (132 sec.) with the CCSU (301
sec.) and EPA (317 sec.) websites, our result is almost
three times lower. We think that this due to the
referential aspect of webometrics.info, where users just
check the position of a university in the ranking.
This paper has shown
there are statistical differences between the sessions
originated from a search engine, a link or from the
root. Thus, visitors from search engines spend more time
and their sessions are larger than the visitors that
come from a link or typing the URL in their browsers.
This may be because the search engines’s users have
already defined their information needs they are looking
for webometrics or something about university rankings,
while the link’s user may arrive to the website surfing
in the web with no clear information seek. These results
confirm the success of the search engines as
navigational agents (Lavene, 2005), because the users
may prefer to search relevant web sites in a search
engine rather than type the url in the browser, which
would explain the differences between search engine’s
users and web site root’s users. Moreover, if these
results could be extensive to other websites, we may
draw the conclusion that the web managers have to give
more importance to the visibility and position of their
websites in search engines, through a good Search Engine
Optimization (SEO) policy (Sen, 2005), because the
visits from that point may be consider the most
important. Anyway, forthcoming studies were will welcome
to explorer these differences in different websites and
to observe if these patterns are general or only are a
particular characteristic of
webometrics.info.
Conclusions
The obtained results allow us
to solve the raised questions. The frequency
distribution of the session length by their number of
click follows an exponential decay which has made
possible to estimate how many sessions there are with n
length. Similar trend has been observed with the session
duration which allows us to estimate how many sessions
of a certain time are spent in our website. The
description of these distributions may help to the
website monitoring, the comparison with other websites
and to know the behaviour of our visitors, improving the
web pages design and our services.
Web log analysis has found
statistical differences between the originated sessions
from different point of access. Thus, sessions coming
from search engines are longer in number of clicks than
the sessions from the web site root. Similar result is
found with regard the spent time by a user that come
from a search engine, a link or the root. Search
engine’s users devote more time to our web site that
user coming from other point of access.
These results allow us
to state that the search engines’ visitors spend more
time and hit more pages than the users from other points
of access. We may then conclude that a good SEO policy
would be justified because the most relevant visits are
those coming from the search engines.
Referencesaaaa
Anick, P. (2003). Using
terminological feedback for web search refinement: a
log-based study. In: Proceedings of the 26th Annual
international ACM SIGIR Conference on Research and
Development in informaion Retrieval, Toronto,
Canada,
Bianco, A., Mardente, G., Mellia,
M., Munafo, M. & Muscariello, L. (2005). Web user
session characterization via clustering techniques. In:
Global Telecommunications Conference, 2005. GLOBECOM
'05. IEEE,
Catledge, L., & Pitkow, J.
(1995). Characterizing browsing behaviors on the World
Wide Web, Computer Networks and ISDN Systems, 27(6):
1065-1073
Cooley, R., Mobasher, B., &
Srivastava, J. (1999). Data Preparation for Mining World
Wide Web Browsing Pattern, Knowledge and Information
Systems, 1(1):5-32
Cooley, R., Mobasher, B., &
Srivastava, J. (1997). Web Mining: Information and
Pattern Discovery on the World Wide Web. In: Proceedings
of the 9th IEEE International Conference on Tools with
Artificial Intelligence, Newport Beach, CA
Deshpande, M. & Karypis, G.
(2004). Selective Markov Models for Predicting Web Page
Accesses, ACM Transactions on Internet Technology, 4(2):
163-184.
Dunn, O. J. (1961). Multiple
comparisons among means, Journal of the American
Statistical Association, 56: 54-64.
Gomory, S., Hoch, R., Lee, J.,
Podlaseck, M. & Schonberg, E. (1999). Analysis and
Visualization of Metrics for Online Merchandizing. In:
WebKDD, Springer, San Diego, CA,
He,
D., Goker, A. & Harper, D. J. (2002). Combining
evidence for automatic Web session identification,
Information Processing & Management, 38(5):
727-742
Hochheiser, H. & Shneiderman,
B. (1999). Understanding Patterns of User Visits to Web
Sites: Interactive Starfield Visualization of WWW Log
Data. Institute for Technical Research: College Park,
Maryland, US
Huang, X. , Peng, F., An, A. &
Schuurmans, D. (2004). Dynamic Web log session
identification with statistical language models, Journal
of the American Society for Information Science and
Technology, 55(14): 1290-1303
Kruskal, W.H. & Wallis, W. A.
(1952). Use of ranks in one-criterion variance analysis,
Journal of the American Statistical Association,
47(260): 583-621.
Kurth, M. (1993). The limits and
limitations of transaction log analysis, Library Hi
Tech, 42: 98-104.
Jansen, B. J. & Spink, A.
(2006). How are we searching the World Wide Web? A
comparison of nine search engine transaction logs,
Information Processing & Management,
42(1):248-263,
Jansen, B. J., Spink, A. &
Pederson, J. (2005). A Temporal Comparison of AltaVista
Web Searching, Journal of the American Society for
Information Science and Technology, 56(6):
559-570
Lam,
H., Russell, D., Tang, D. & Munzner, T. (2007).
Session Viewer: Visual Exploratory Analysis of Web
Session Logs. In: IEEE Symposium on Visual Analytics
Science and Technology, Sacramento, CA,
Lavene, M. (2005). An Introduction
to Search Engines and Web Navigation, Pearson Education,
London
Markov, Z. & Larose, D. T.
(2007). Exploratory Data Analysis for Web Usage Mining.
In: Z. Markov, D. T. Larose (Eds.) Data Mining the Web:
Uncovering Patterns in Web Content, Structure, and
Usage, Wiley
Nasraoui, O., Krishnapuram, R.
& Joshi, A. (1999). Mining Web Access Logs Using
Relational competetive Fuzzy Clustering. In: 8th
International Fuzzy Systems Association World Congress,
Taipei, Taiwan
Ortega, J. L., Cothey, V. &
Aguillo, I. F. (2009). How old is the Web?
Characterizing the age and the currency of the European
scientific Web, Scientometrics, 81(1):
295-309
Peters, T.A. (1993). The history
and development of transaction log analysis, Library Hi
Tech, 42: 41-66.
Pitkow, J. (1997). In search of
reliable usage data on the WWW. In: Sixth International
World Wide Web Conference, Santa Clara, CA,
451-463
Sen,
R. (2005). Optimal Search Engine Marketing Strategy,
International Journal of Electronic Commerce,
10(1):9-25
Silverstein, C., Henzinger, M.,
Marais, H. & Moricz, M. (1998). Analysis of a Very
Large AltaVista Query Log, SRC Technical note #1998-14.
http://citeseer.ist.psu.edu/70663.html
Silverstein, C., Marais, H.,
Henzinger, M. & Moricz, M. (1999). Analysis of a
very large web search engine query log, ACM SIGIR Forum,
33(1): 6 -12
Spiliopoulou, M. (2000). Web Usage
Mining for Web Site Evaluation. Communications of the
ACM, 43(8)
Thelwall, M. (2001). Web log file
analysis: Backlinks and queries, ASLIB Proceedings, 53:
217-223.
Teevan, J., Adar, E., Jones, R.,
& Potts, M. (2006). History repeats itself: repeat
queries in Yahoo's logs. In: Proceedings of the 29th
Annual international ACM SIGIR Conference on Research
and Development in information Retrieval, Seattle,
USA,
Wang, W. & Zaïane, O. R. (2002).
Clustering Web Sessions by Sequence Alignment. In:
Proceedings of the 13th international Workshop on
Database and Expert Systems Applications, Washington,
USA, | |
|
| |
| |